At some point in every self-hosted infrastructure, you end up with a Grafana instance that nobody opens. The dashboards are still there. Prometheus is still scraping something. Loki is still collecting some logs. But if you actually asked "what does this stack tell you about your systems?" – the honest answer would be "I'm not sure anymore."
That's where my lab was earlier this year. Monitoring existed. Monitoring worked, in the sense that the containers were running and the graphs rendered. But the dashboards were a mix of imported community ones I'd never read, a few panels I'd built during initial setup and never revisited, alert rules that either fired constantly for noise or never fired at all, and log aggregation I'd configured once and forgotten about.
So I did what any reasonable engineer does when confronted with cruft they can't remember the shape of: I deleted it all. Configs nuked, data volumes wiped, fresh start. And then I rebuilt the whole thing in an afternoon, this time with a clear idea of what each piece was supposed to do.
This post is the story of that rebuild – and more importantly, the design choices I'd carry over to a client engagement where the goal is "make monitoring something your team actually uses."
What I was monitoring, and from where
Before any tool discussion, I had to answer the basic questions: what do I actually want to know about my infrastructure, and what's the best vantage point to know it from?
My setup: a Proxmox host (16 cores, 40GB RAM, ZFS on NVMe, 18TB of spinning disk) running an LXC container that hosts the entire Docker stack (40+ services). There are two distinct layers of things I care about:
- Host-level metrics – CPU, RAM, disk I/O, network throughput, filesystem usage, temperatures, power state. These exist on the physical Proxmox machine, and if I run node_exporter inside the LXC I only see the cgroup-limited view – not the real hardware. The host is the right vantage point for host metrics.
- Container-level metrics – CPU/memory/network per container, so I can see which of my 40 services is eating the most RAM today. These are inherently a container-runtime thing, collected by cAdvisor inside the Docker LXC.
- Application metrics – Traefik request rates and response times (so I can see if something is being hammered), AdGuard DNS query stats (because I'm curious how much of my network traffic is ads/telemetry getting blocked), and Prometheus self-monitoring for when the monitoring itself breaks.
- Logs – everything every container is writing to stdout/stderr, centralized and searchable.
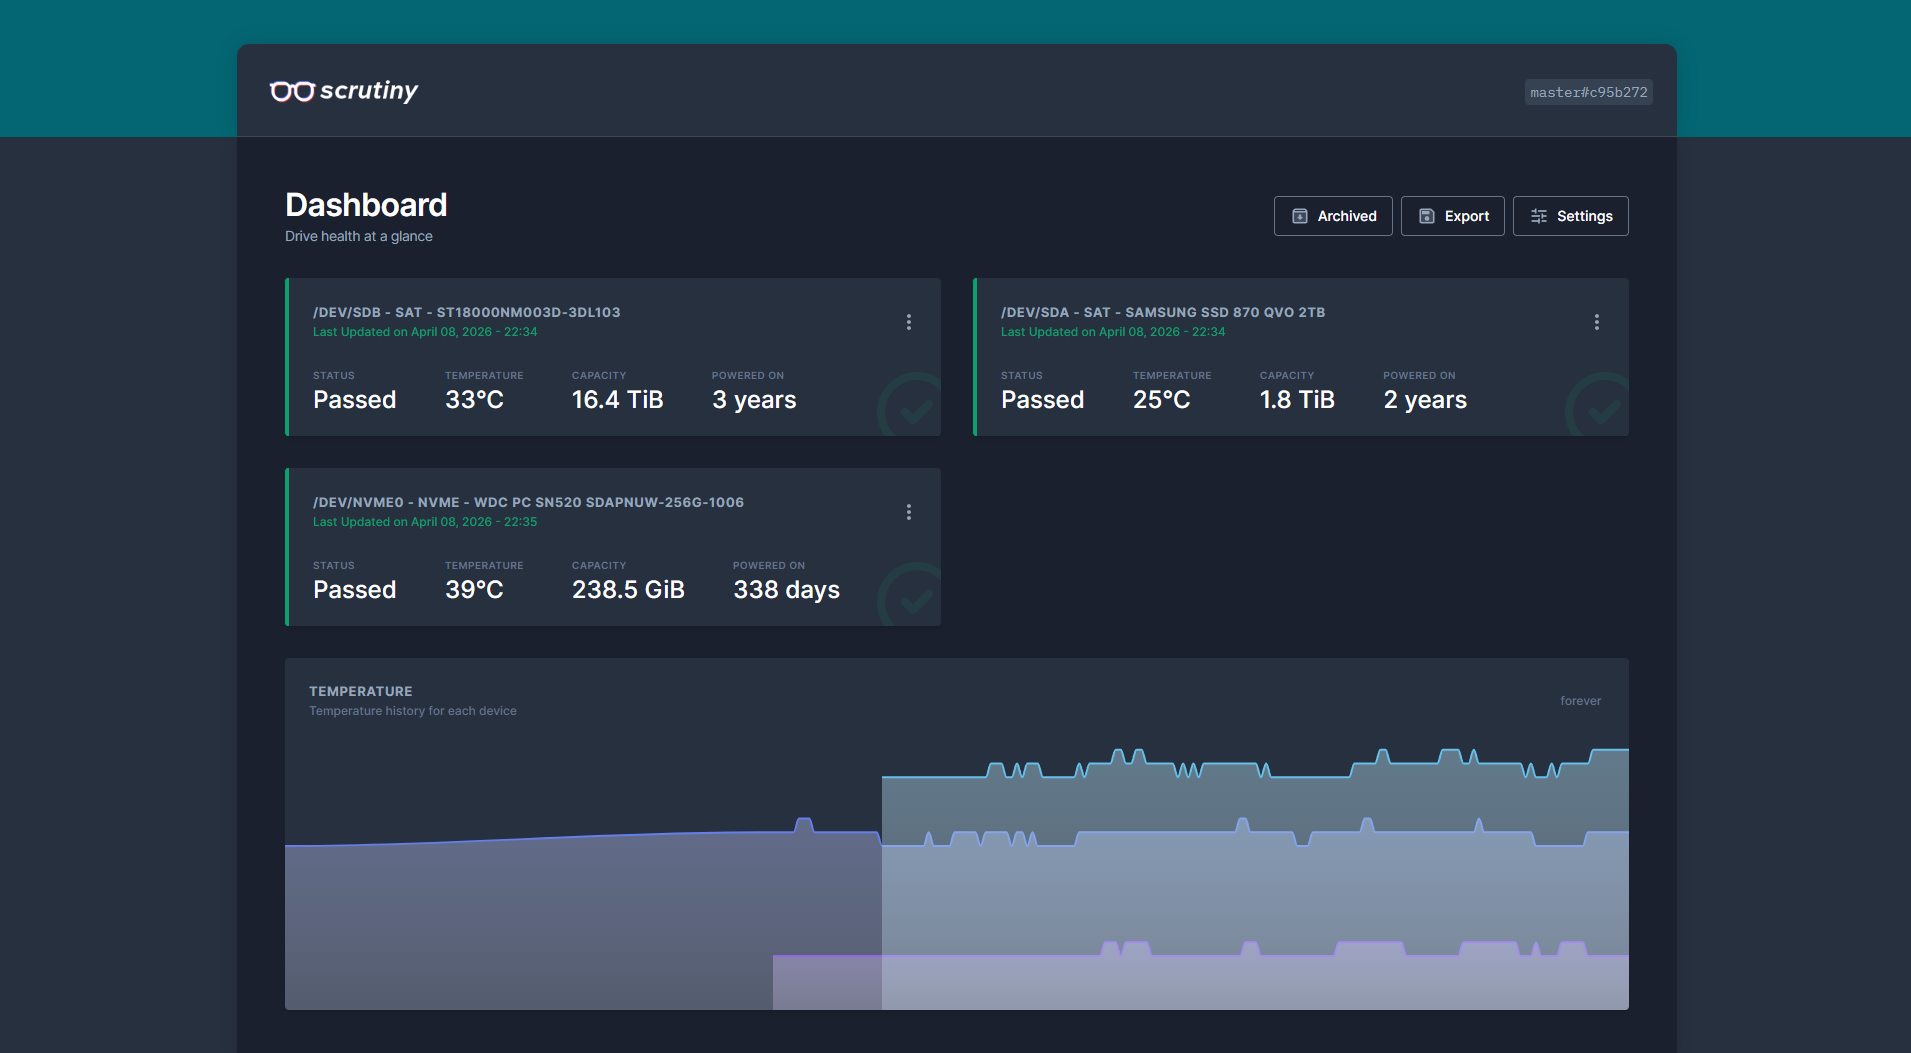
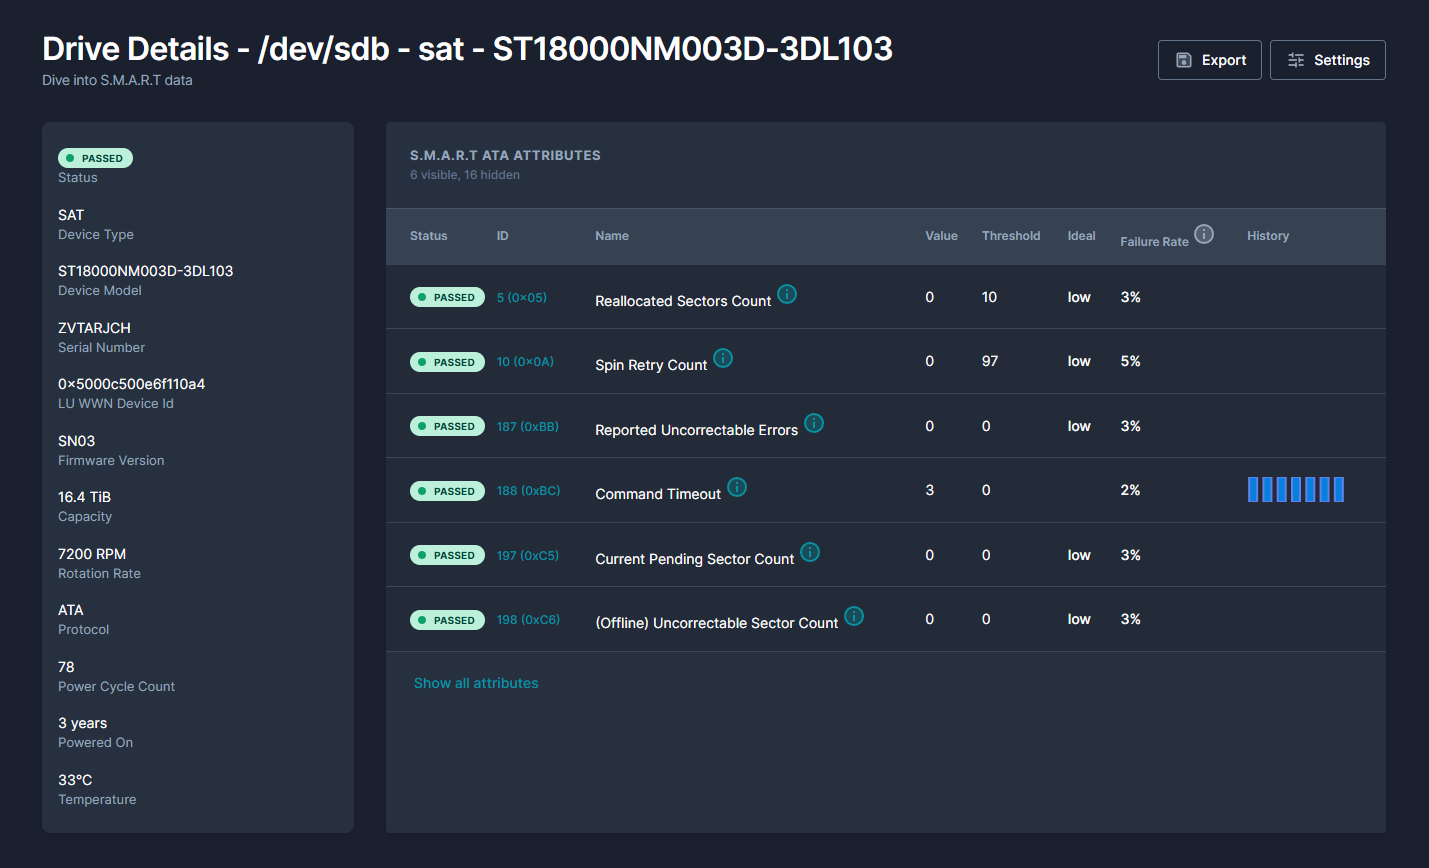
- Disk health – SMART data from the spinning disks and SSDs on the host, because silently-failing drives are the kind of problem you want to know about weeks before they take data with them.
- Uptime – an external-style "can I actually reach this service over HTTPS" check for every exposed service, independent of whether the service is reporting itself as healthy internally.
That's six distinct things. No single tool covers all of them well, so the stack is layered by design.
The stack
Prometheus as the central metrics database. 60-second scrape interval (tight enough to catch real problems, loose enough to not generate unnecessary I/O or retention pressure), 90-day retention, scraping from:
node_exporterrunning as a systemd service on the Proxmox host itself, not inside the LXC – this gives the real hardware viewcAdvisorinside the Docker LXC, auto-discovering every running container- Traefik's built-in Prometheus metrics endpoint (enabled in
traefik.yamlwithmetrics.prometheus) - The AdGuard exporter, which turns AdGuard's stats API into Prometheus-compatible metrics
- Prometheus scraping itself (always do this – you want to know when your monitoring breaks)
Grafana as the visualization layer, with four dashboards I actually use:
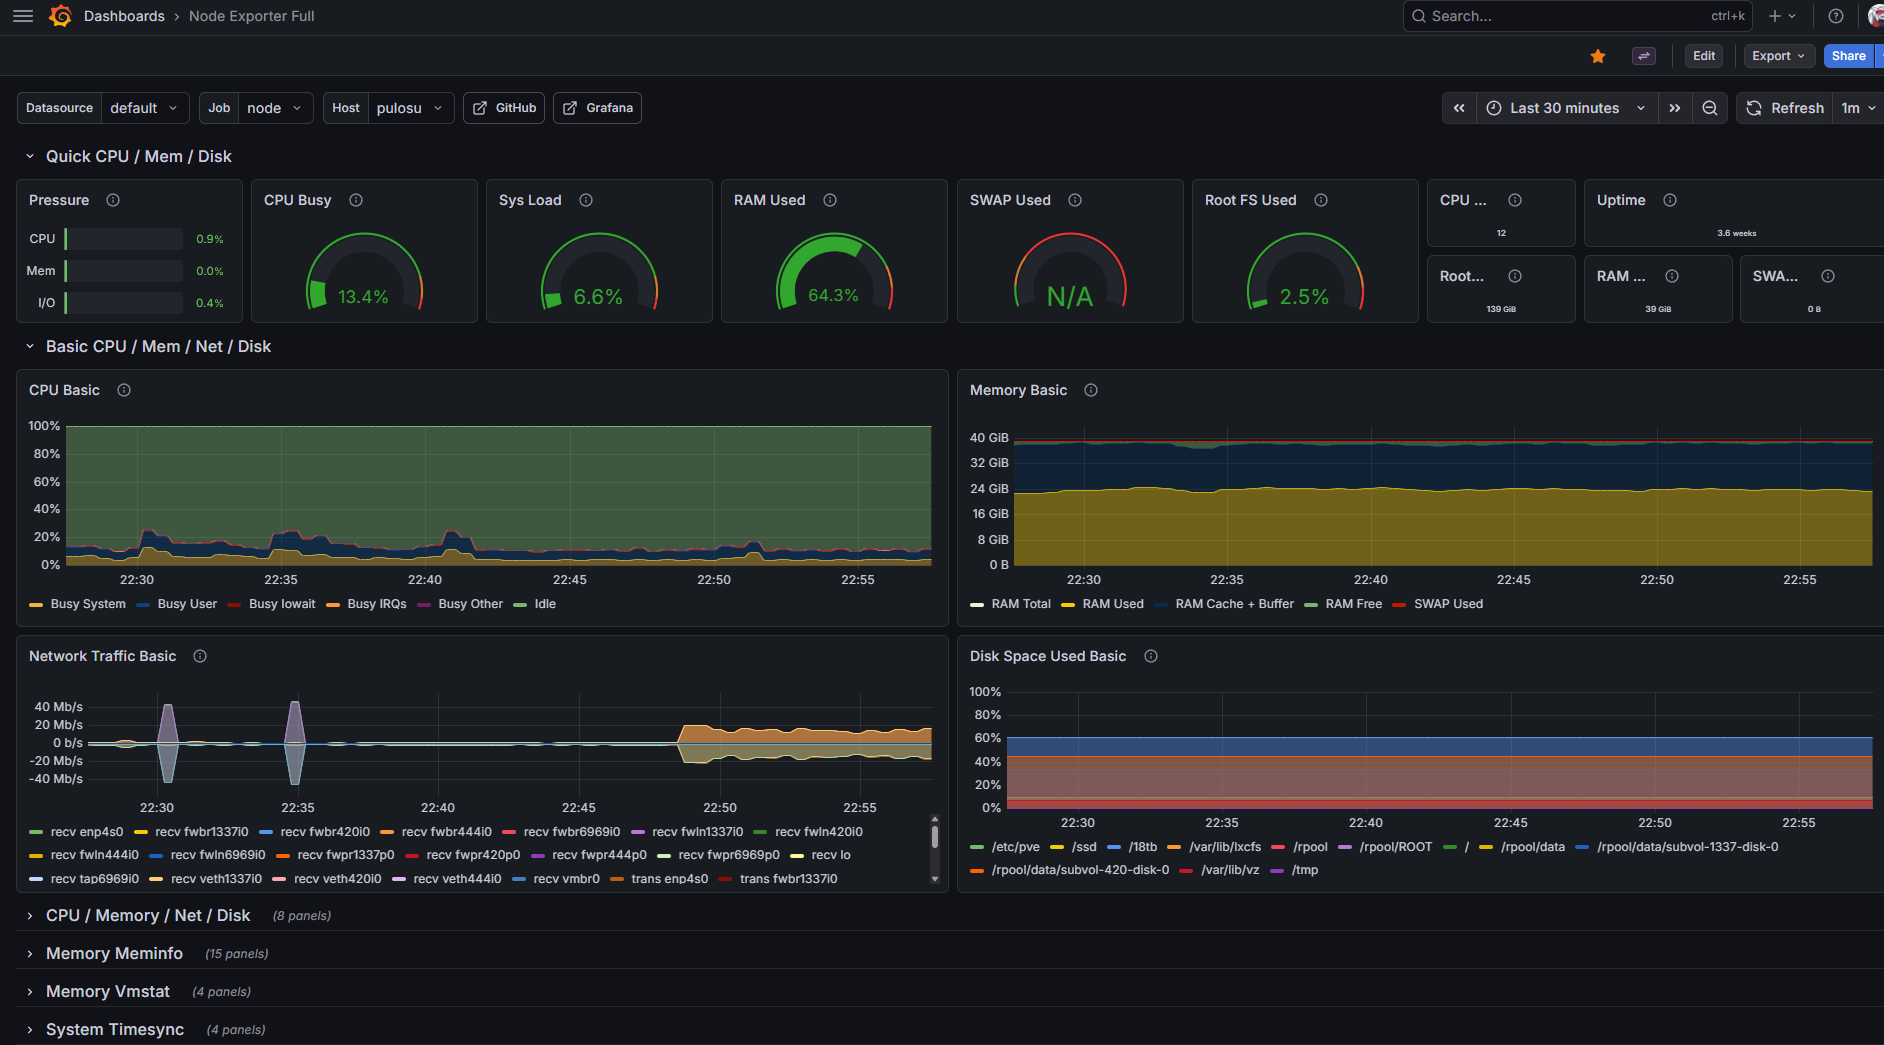
- Node Exporter Full (Grafana dashboard ID 1860) – the definitive Linux host dashboard. Shows everything node_exporter collects in one place. I use this to answer "is my Proxmox host healthy" at a glance.
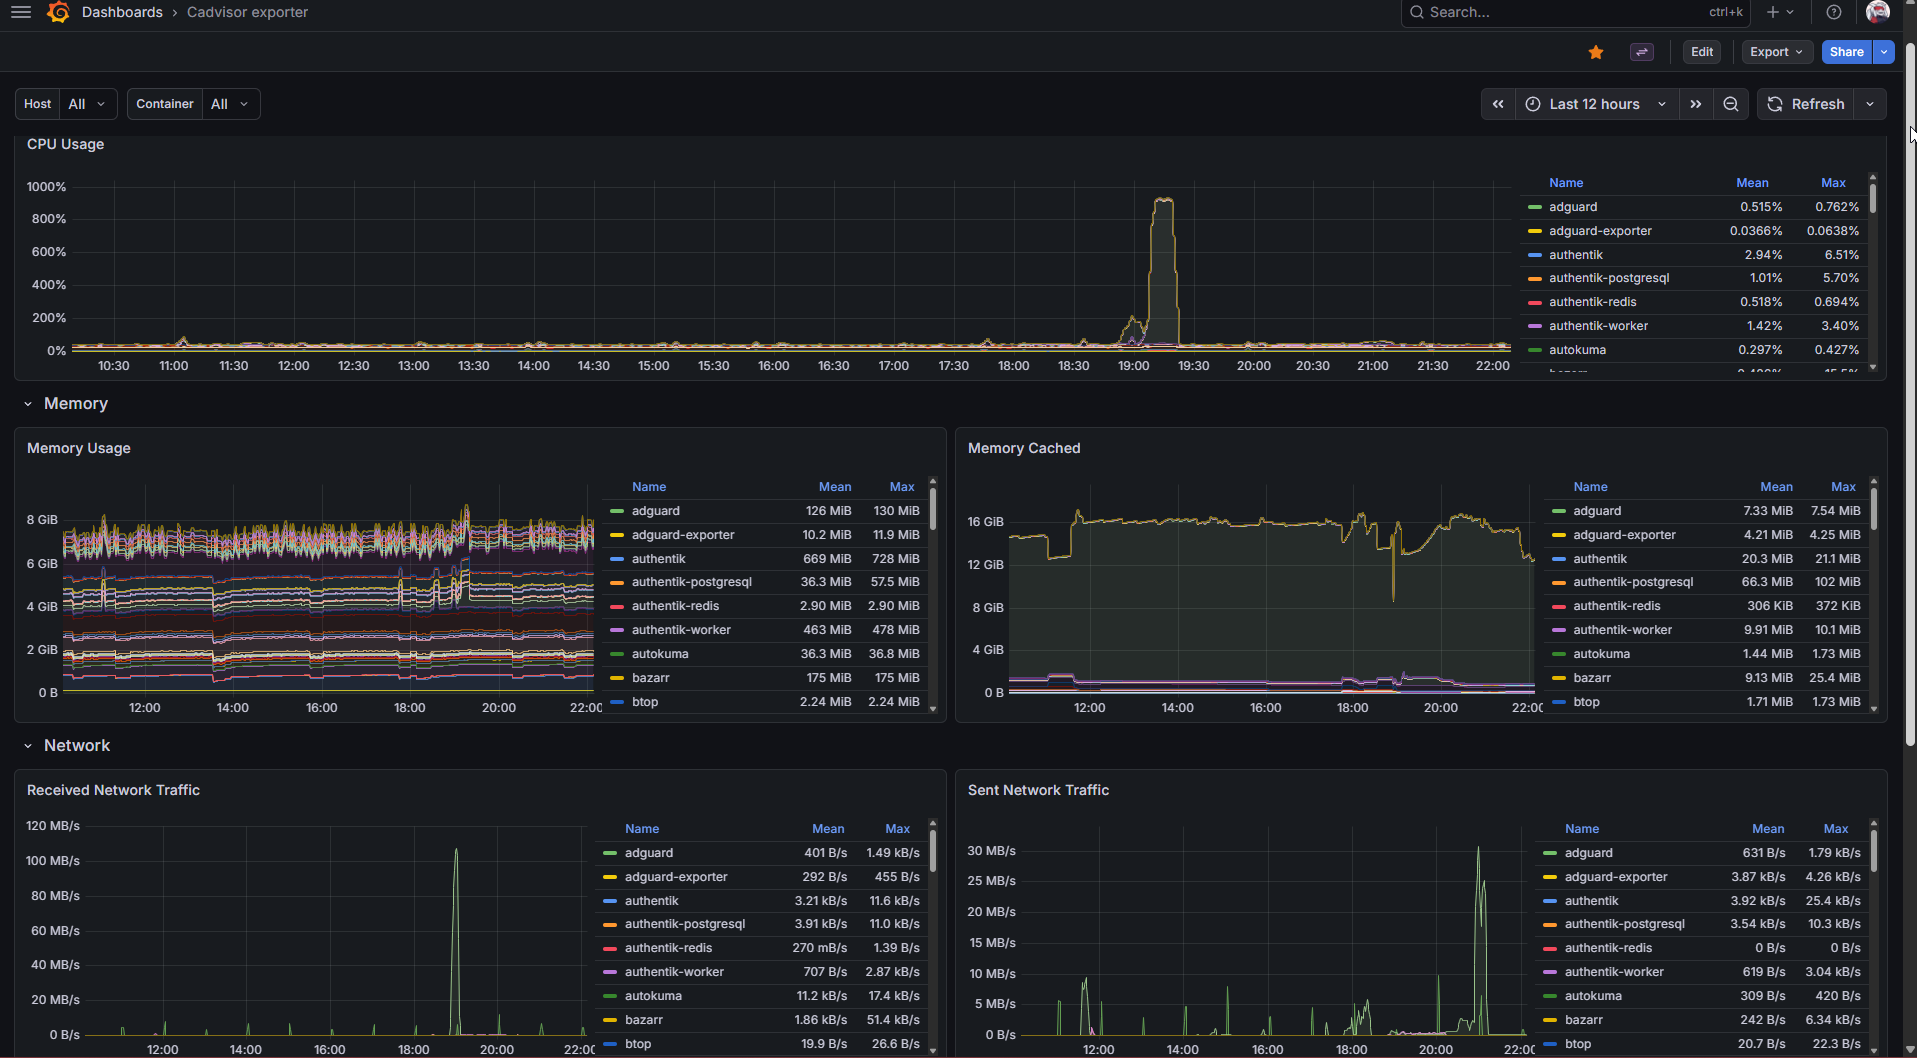
- cAdvisor / Docker containers (ID 14282) – per-container CPU, memory, network, disk. Answers "which container is the weird one today."
- Traefik (ID 17346) – request rates, response times, status codes per router. Answers "are any of my services being slow or returning errors."
- AdGuard (ID 13330) – DNS query stats, blocked percentage, top blocked domains. Mostly curiosity, occasionally useful.
All four are community dashboards. I didn't build them from scratch, and I wouldn't recommend a client build them from scratch either – the imported ones are excellent starting points, and you can customize them after you know what you actually want to see.
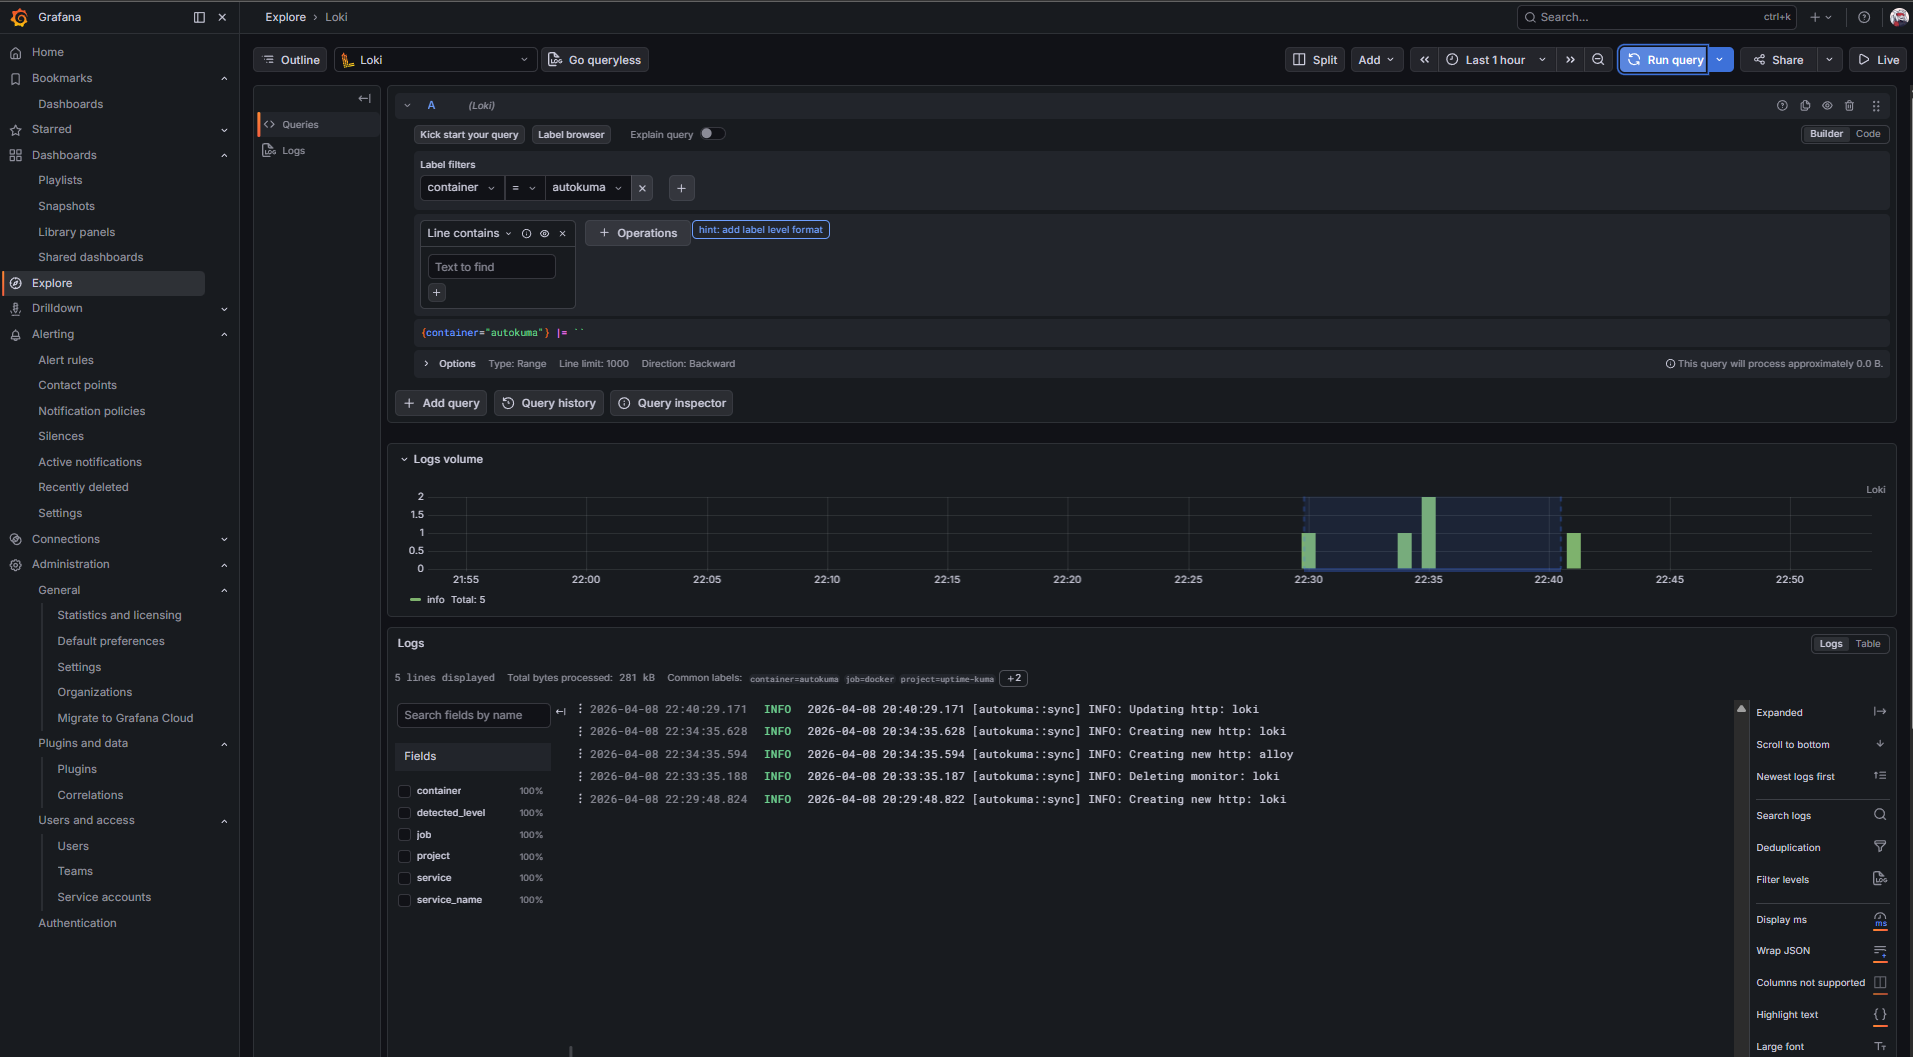
Loki + Promtail for centralized logs. Promtail runs in the Docker LXC, mounts the Docker socket, auto-discovers every container, and ships every stdout/stderr line to Loki. Loki is configured as a Grafana datasource, so I can query logs alongside metrics in the same interface. Critical for debugging: when a container starts misbehaving, I don't have to SSH anywhere – I open Grafana, filter logs by container name, and read.
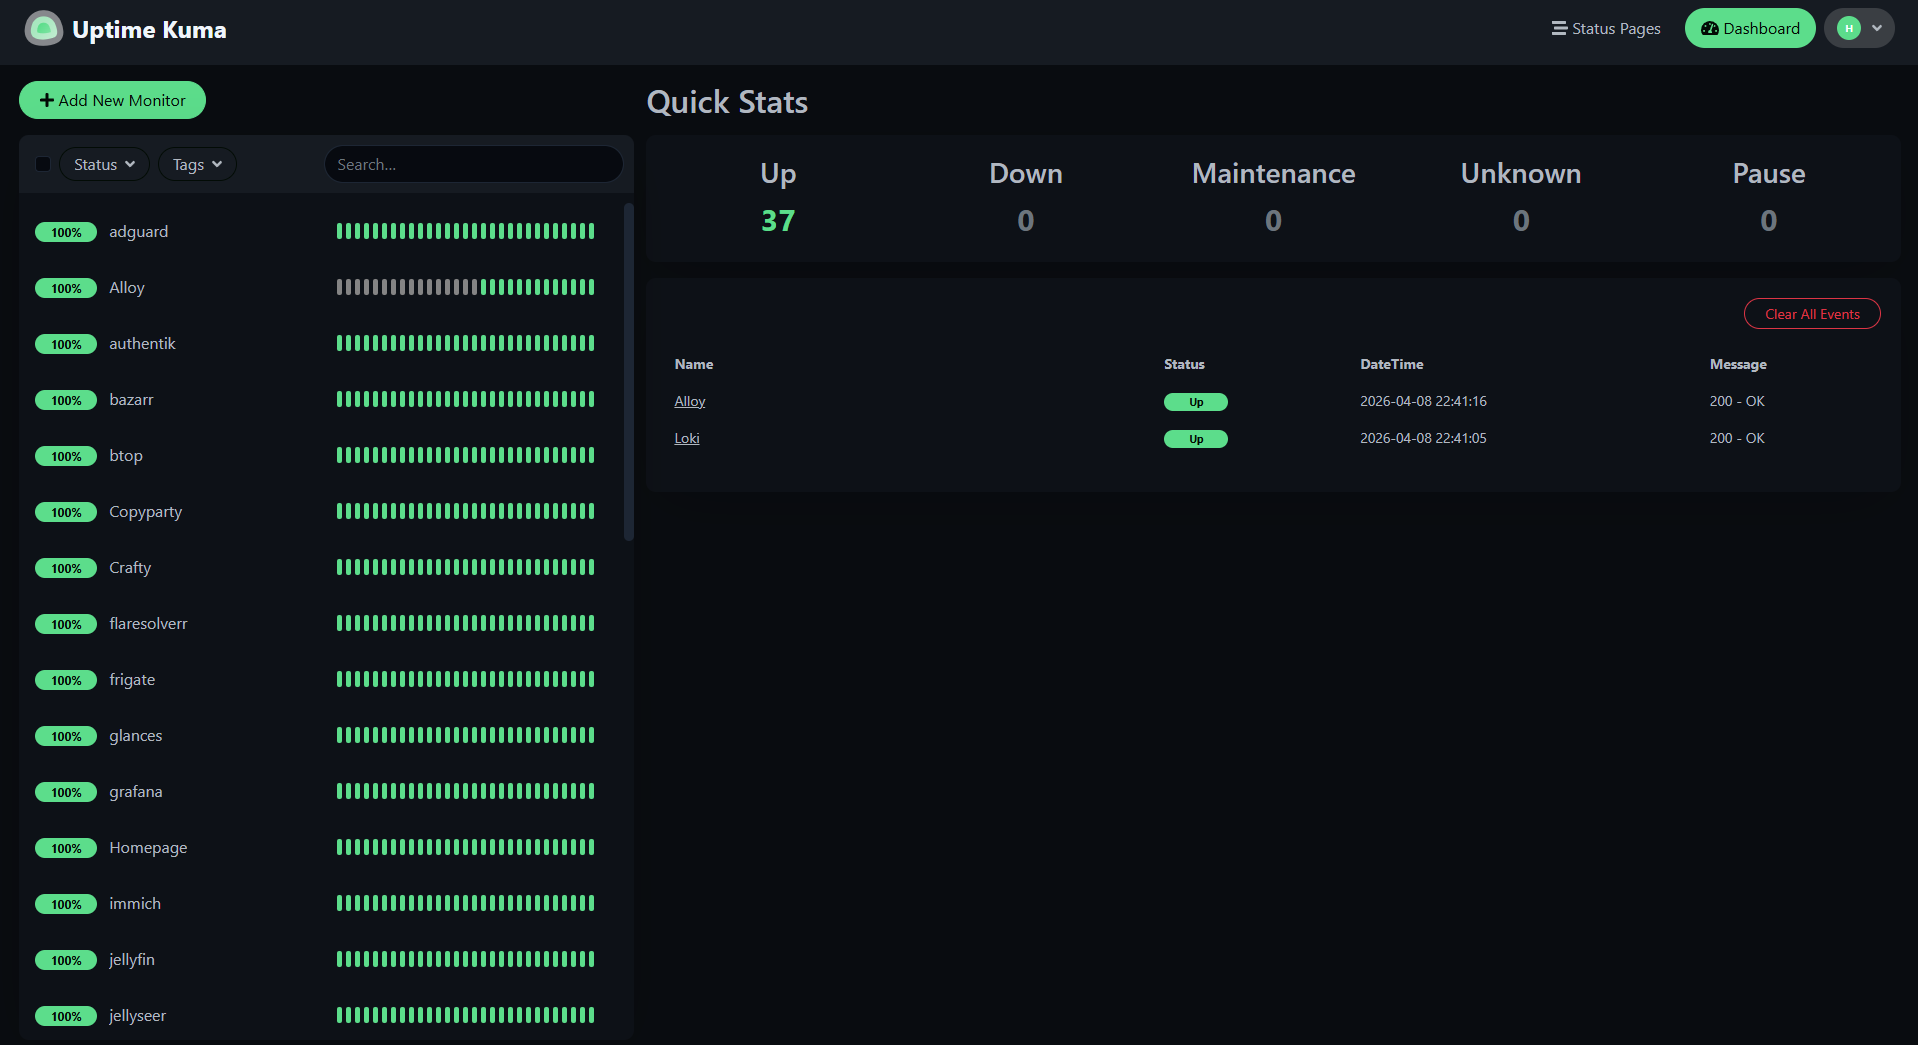
Uptime Kuma + AutoKuma as an external-style health check. AutoKuma reads Docker labels on every running container and automatically creates a Uptime Kuma monitor for each service's public URL, hitting it over HTTPS from outside the Docker network. This catches a failure mode Prometheus doesn't: when the container is technically running and reporting healthy to cAdvisor, but Traefik can't route to it, or the TLS cert has expired, or the DNS record is wrong. If a real user would see an error, Uptime Kuma sees it first. Alerts go to Discord and email.
Scrutiny for SMART monitoring. The Scrutiny collector runs as a script on the Proxmox host (where the actual disks are), reads SMART data daily, and POSTs it to the Scrutiny web UI running inside the Docker LXC. Daily is the right interval for SMART – the data changes slowly, and running smartctl every minute accomplishes nothing except wearing down the stats counter.
The design decisions worth knowing
A few of the choices in this stack are more interesting than they look:
node_exporter belongs on the host, not in the container. This is a small thing that trips up a lot of people. If you run node_exporter inside a container, you get a container's view of the world – memory limits set by cgroups, CPU time accounted against the container's share, only the filesystems mounted into the container. For container-level metrics that's exactly what you want. But for host-level metrics – "is my physical machine healthy" – you need the view from the host itself. So node_exporter runs as a plain systemd service on Proxmox, Prometheus scrapes it across the network, and cAdvisor handles the per-container view separately.
60-second scrape intervals, not 15. The default Prometheus tutorials all use 15-second intervals, which is fine for cloud-native production with rapid failures. For a personal lab (or most SMB infrastructure), 15 seconds is overkill: it generates 4× the I/O, 4× the disk usage, and 4× the network traffic, in exchange for detecting problems 45 seconds faster than you'd detect them at 60 seconds. Nothing I care about in a lab needs sub-minute resolution. For client engagements, I'd recommend the same: start at 60s, drop to 30s only if a specific metric demands it.
Dashboards refresh at 5 minutes, not 30 seconds. Grafana defaults dashboards to a 30-second auto-refresh, which means every open tab is re-querying Prometheus twice a minute even when nobody is looking at it. If you have five dashboards open across three devices, that's 30 queries/minute of background load forever. Setting dashboards to 5-minute refresh by default (and manually refreshing when you actively care) drops that to near-zero. Metrics still update in the graph – you just see them slightly later. Nobody has ever noticed the difference except the disk.
Alerts go to Discord via webhook, not email. Email alerts train you to ignore them, because email is already a firehose of other things. Discord alerts arrive in a dedicated channel, make a sound, and have a clear recent-history view. For a solo personal lab, this is dramatically more useful. For a team, the same principle applies with Slack instead of Discord.
AutoKuma was the "oh this is actually clever" moment of the rebuild. Rather than manually creating a Uptime Kuma monitor for every new service, AutoKuma reads Docker labels from the socket and creates monitors automatically. The only thing I had to do was add four labels to each compose file – which, because of the YAML anchor pattern I'd already built, meant adding one anchor reference to each service's label block and updating an x-kuma-labels template. Fully retrofitted across 30+ services via a bash script that ran in under ten minutes of wall-clock time.
The dashboard philosophy that matters most
Here's the one piece of advice I'd give anyone building monitoring for the first time, hobbyist or client: if you're not sure you'd open the dashboard in a real incident, delete the dashboard.
The most common monitoring-cleanup project I see (and that I'd happily do for clients) isn't "add more metrics" – it's "delete the dashboards nobody reads so the ones that matter are easier to find." Grafana lets you stack dozens of panels on a single page with zero friction, which means most environments end up with pages of panels that nobody has looked at since the day they were added. Three well-designed dashboards you actually use beat thirty dashboards that exist because you forgot to delete them.
My rule of thumb: a dashboard earns its place if someone would open it during an active problem. The Node Exporter Full dashboard earns its place because if I suspect the host is overloaded, that's where I look first. The cAdvisor dashboard earns its place because if a specific container is misbehaving, I need per-container metrics. The Traefik dashboard earns its place because request-level issues show up there before anywhere else. The AdGuard dashboard is honestly borderline – I don't look at it during problems, only out of curiosity – and I keep it because the cost is negligible, but if I had to defend it in a review I couldn't.
If you can't explain why a dashboard exists in one sentence starting with "when X happens, I open this to see Y," it doesn't earn its place.
The outcome
A few things that changed concretely after the rebuild:
- Open-to-information time dropped significantly. When something acts up, I can go from "I notice a problem" to "I know which service and roughly why" in under a minute. Before, I'd spend five minutes orienting myself in a dashboard I didn't remember building.
- Alerts are now signal, not noise. The Discord alert channel fires maybe twice a week, and when it fires I actually look. Before, the old alert rules had trained me to ignore the notification.
- New service monitoring is free. Because of the AutoKuma + Docker-label pattern, adding a monitor to a new service is zero effort – the label is part of the standardized compose template, so every new service is automatically monitored from day one. The only time I manually touch Uptime Kuma now is to silence something I'm intentionally taking down.
- Log search is a real tool now. Instead of
docker logs -f container_nameacross an SSH session, I open Grafana, filter by container, use Loki's query language to scope to the time window I care about, and find what I need in seconds. For multi-container issues (where I need to correlate logs across services), this is the only sane way.
What I'd do differently
Two things.
Start with fewer dashboards. The temptation when setting up Grafana is to import every community dashboard that looks relevant, because importing is one click. I resisted this mostly, but I still ended up with one dashboard (AdGuard) I rarely open. A stricter rule – "I will only import dashboards I can explain a use case for" – would have kept the collection tighter. For client work I'd make this explicit: we start with two dashboards, add a third only when there's a specific thing it answers.
Set up log retention policies from day one. I configured Loki with default retention, which turned out to be quite generous, and now my log volume directory is larger than I'd expect. Setting a 14- or 30-day retention policy in loki.yaml from the start would have been trivial; retrofitting it means deleting a bunch of old data. Same lesson as the compose standardization case study: the right time to set a pattern is before it accumulates, not after.
Tech stack
Prometheus (with node_exporter on the Proxmox host, cAdvisor for containers, Traefik's native metrics endpoint, AdGuard exporter), Grafana (with community dashboards 1860, 14282, 17346, 13330), Loki + Promtail for log aggregation, Uptime Kuma + AutoKuma for external health checks, Scrutiny for SMART monitoring. All containerized except node_exporter and the Scrutiny collector, which run natively on the Proxmox host. Configuration in the lab repo.
The takeaway for client work
The monitoring rebuild in this post took an afternoon. Most of the time wasn't "install tools" – it was "decide what I actually want to know." The tools are straightforward; the design decisions are where the value is.
This is exactly the kind of engagement I sell as the Monitoring stack setup & cleanup package: three weeks, fixed price, one working monitoring stack at the end that your team will actually use. Whether that means setting up Prometheus/Grafana/Loki from scratch on your infrastructure, or auditing and cleaning up a monitoring stack that's become shelfware, the pattern is the same: understand what matters, build for those questions, delete the rest, and leave behind documentation so someone else can maintain it when I'm gone.
If your team has Grafana running but nobody opens it, that's the signal.